
Internship Employment
| Industry | Students | Percent of Class |
|---|---|---|
| Financial Services | 139 | 44% |
| Consulting | 67 | 21% |
| Technology / Science | 18 | 6% |
| Accounting | 14 | 4% |
| Media / Entertainment | 14 | 4% |
| Transportation / Logistics | 8 | 3% |
| Healthcare | 7 | 2% |
| Real Estate / Construction | 7 | 2% |
| Retail | 6 | 2% |
| Sports & Leisure | 6 | 2% |
| Consumer Packaged Goods | 5 | 2% |
| Legal | 2 | 1% |
| Manufacturing | 2 | 1% |
| Marketing / Advertising / Public Relations | 2 | 1% |
| Non-Profit | 2 | 1% |
| Other | 19 | 6% |
Note: Compensation information is self-reported. Seventy-three percent of students reported accepting offers also reported salary data. Salary data is not reported for functions with fewer than two points of data. Other Industry includes Defense, Education, and Other. Other Function includes Education and Other. Numbers may not add to 100% due to rounding.
-
Paid or for Credit Internships
Class of 2023 -
Internships Inside the U.S.
Class of 2022 -
Mean Hourly Internship Salary
Class of 2023
Internships by Region
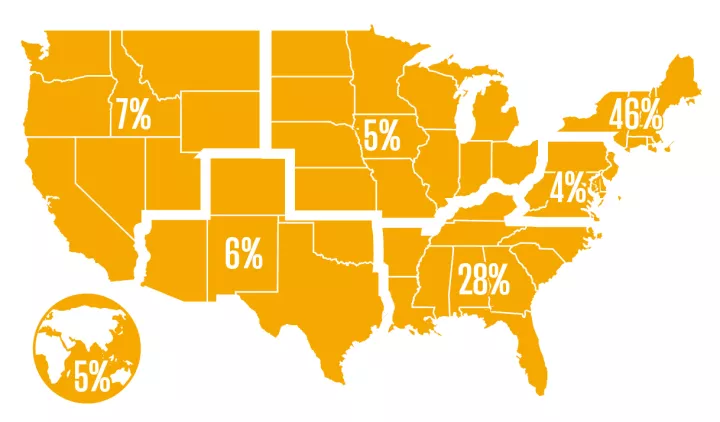
International Internship Destinations: Austria, China, France, Hong Kong, Panama, Singapore, Taiwan, Thailand